Archive for the ‘Samples’ Category

GestureWorks Open Source Gesture Library – Update

Monday, January 10th, 2011


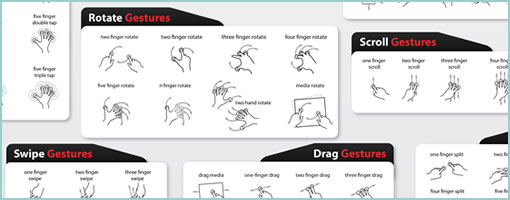
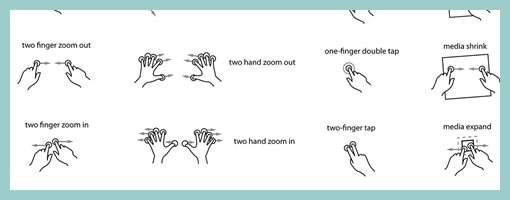
The gesture library from gestureworks has been recently expanded to contain a total of 200 illustrations. The library now contains multi-touch as well as stroke gestures in a variety of bitmap and scalable formats. It’s loaded with swipes, drags, flicks, holds, scrolls, taps, and even 3D gestures. For showing stroke direction, they’ve come up with an interesting way of starting off each stroke with a blue circle and ending with a red one. Pretty cool and inspirational ways of showing off user actions.

Credits: gestureworks

Site Architecture Stencil for OmniGraffle

Tuesday, October 26th, 2010


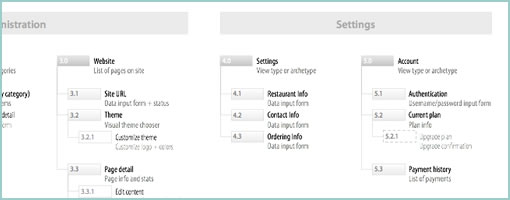
Austin recently came up with a sitemap or site architecture OmniGraffle stencil that makes room for some extra description. In the stencil, beside each page title there is now a little space for an explanation of what the page is about. He shared the downloadable stencil which can be obtained right from his site. Awesome. Thanks!

In his own words:

I’ve used EightShapes’s brilliant Unify deliverable system for about four years. It’s excellent.

Out of the box, Unify is designed for use with Adobe InDesign. Lately, however, I’ve been site mapping in sweet, luscious OmniGraffle, and I created a Unify-inspired OmniGraffle stencil for making site maps.

But, there’s one problem with lots of site maps.

In your typical site map, you show the page’s title adjacent to the little box for that page. Unfortunately, clients and developers and designers don’t always know what kind of page the page will be. In other words, if you have a page titled, “Orders”, it’s not clear if that’s a dashboard, a list of orders, or even a form form for adding an order.

So I added a line for every page on the site map where you can offer a very brief description of the page.

Credits: Austin Govella

WireMolecules

Wednesday, May 19th, 2010


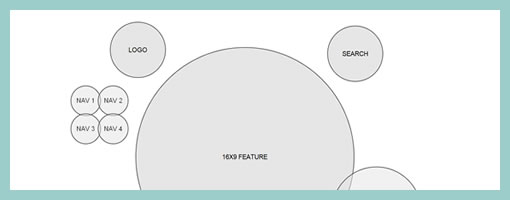
Here is an interesting example of a highly abstracted wireframe, labelled as a WireMolecule. Both the position and size of the represented elements within this example no longer represent what the interface will really look like. Instead, the focus has been shifted to showing relationships between elements as denoted by their proximity to each other. The size I also believe represents the importance of each element and not the actual size either (as also seen here and here). Definitely something a little different from a traditional wireframe. Andreas writes:

Traditional wire frames are misleading as they look too much like finished designs. Clients and designers alike run the risk of taking their direction too literally. And yet, despite all this, wire frames are invaluable tools in the start of any website design project.

And defines a WireMolecule as:

A chart giving an overview of relationships between components and features of a website. Wire molecules are developed during the Website Discovery phase and they provide instructions to designers, developers, and clients for how pages will look and behave.

Credits: Andreas Holmer

GestureWorks – Open Source Gesture Library

Wednesday, May 5th, 2010


GestureWorks has released 20 something gesture icons for their Flash and Flex development environment. Although their multitouch library is geared at developers, the icons still look interesting in their own right. A lot of the interactions supported include two handed, as well as multi finger gestures. The downloadable library comes in various formats (PNG, PDF and EPS). Enjoy.

Also, I just created the gestures tag to keep track of all these related posts.

Credits: GestureWorks

Blueprint+ (Service Design Visual)

Wednesday, April 14th, 2010


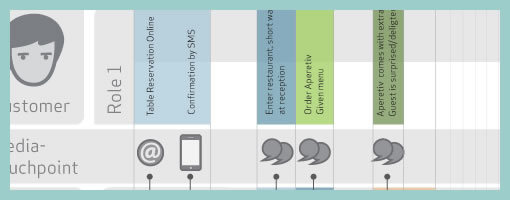
The academic group over at Hochschule Luzern (Competence Center) in Switzerland have recently explored a visual representation that captures the interaction of various people across multiple services or touch points. Done in the context of a service design assignment, the Blueprint project portrays the flow of time horizontally and captures multiple actors vertically. More so, the visualization also layers additional data underneath and contains such things as fail lines, emotions and costs, while at the same time leaving more room for additional variables. In some way, the deliverable shares some resemblance to the Experience Maps posted earlier.

As an additional note, Blueprint+ is still a work in progress and will be turned into a toolkit in the future. Stay tuned. :)

Credits: CC Explanations and Services, Hochschule Luzern (Andy Polaine, Roman Aebersold, Robert Bossart and Andrea Mettler)

Usability Test Snapshots

Wednesday, April 7th, 2010


Usability testing is a pretty standard practice and I assume most of us here have done or might do a few of these evaluations in their design careers. Last month, I had the chance to spend some time with end users on a software project and I thought of sharing some of the documentation which resulted from the activity.

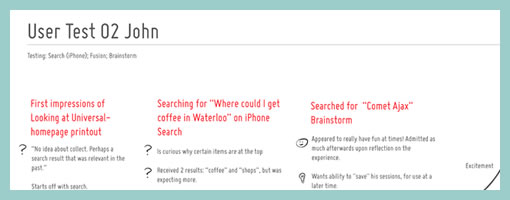
Right after doing such a test, we’re often faced with the challenge on how to capture and convey some of the interesting findings to others on the team or even ourselves. Some people try video, while others overlay the identified problems on top of screen captured images. In this round of testing I was aiming for something slightly different. Essentially, I wanted to a capture the core notes per each user on a single piece of 8.5×11 paper (perhaps in a persona like fashion?). Each page would have starting points of what the user has initially done with the use of red text, followed by dark grey notes as the actions unfolded. The findings were then tagged accordingly as: ideas (light bulb symbol), confusions (question mark) or positive remarks (happy face). Further more, the sample also makes use of subtle informal sketches through out the page to help convey the issues somewhat visually.

Perhaps to someone who lacks context of the project or products being tested, a deliverable such as this might not be adequate enough at conveying the issues. On the other hand, for those who have participated in the test as observers, the following usability test snapshot might act as an inspiration piece for the design work ahead.

Please post as a comment (or submit) ideas of your own on how to best convey, remember or prioritize findings from design research.

Credits: Jakub Linowski

Experience Maps

Wednesday, February 24th, 2010


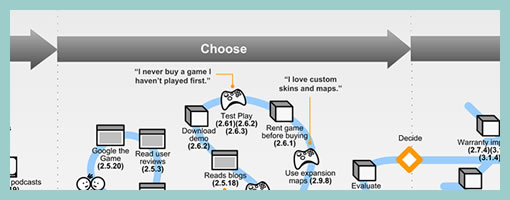
An interesting depiction of user experience has surfaced the other week over at the nForm blog in the form of an experience map. Gene and his team has come up with a way to represent gaming related experiences of three distinct gamers. In a way then this is a merger between a persona and a time based representation. The other interesting thing about this is the visualization and separation of at least three types of experiences: ongoing, exploratory and influenced. Each type of experience has been shown in a standardized and specific way. Furthermore, the diagram also captures and represents a variety of channels which the personas are utilizing at a given point in time. Overall, it’s always interesting to see when designers attempt to convey such comprehensive and unified high level deliverables.

Credits: Gene Smith of nForm

Use Case Maps

Friday, February 19th, 2010


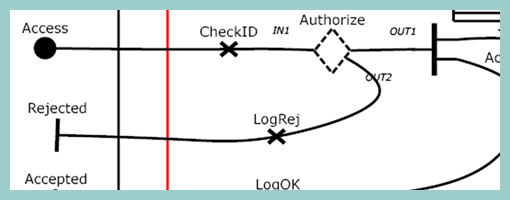
Speaking with Greg the other day I learned about Use Case Maps. This notation which has been initially the work of Raymond Buhr, has its roots in software engineering and perhaps could be an area to draw inspiration from. Use Case Maps intend to convey sequences of events by showing the paths of users over a backdrop of structured system representations. With these flexible scenario-like visualizations, software engineers ensure that the element of time is considered. As part of the notation, Use Case Maps have starting and stopping points and can also branch out. It seems like Daniel Amyot has contributed to this work as well and has published a decent Quick Tutorial with a reference guide at the end. In a nutshell, here is what Daniel writes about the philosophy of UCM:

The Use Case Map notation aims to link behavior and structure in an explicit and visual way. UCM paths are first-class architectural entities that describe causal relationships between responsibilities, which are bound to underlying organizational structures of abstract components. These paths represent scenarios that intend to bridge the gap between requirements (use cases) and detailed design.

Credits: Raymond A. Buhr & Daniel Amyot

Gesturcons: Touch Pack 1.0

Tuesday, February 16th, 2010


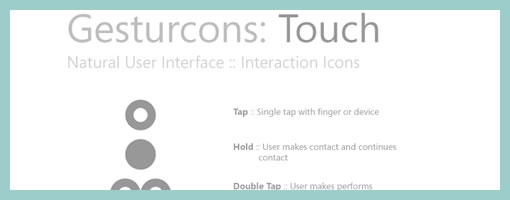
Ron has recently initiated a project with the intention of creating a visual language for representing gesture based user actions. He shares the belief of “gain[ing] common grounds when discussing interactions” and has just released the Gesturcon Touch Pack under a Creative Commons Attribution-Noncommercial-No Derivative Works 3.0 United States License. The zipped file contains EPS, PNG and Illustrator files for your use. His approach supports such interactions as taps, holds, double taps, flicks and is achieved with circular shapes. @vitorious also threw the idea of combining this with my own notation. Hmm, pretty cool.

Credits: Ron George

Tablet + Illustrator: the Case for Electronic Sketching

Thursday, February 4th, 2010


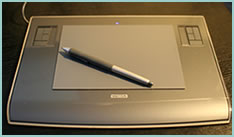
It’s probably nothing new that the sketch has been gaining quite some attention lately as a powerful design tool. Some UI designers have began to precede wireframing and prototyping with free-form pen and paper approaches that afford exploration and support a wider diversity of ideas. For over a year now, in my design process I’ve started doing just the same right after I picked up a set of markers and sketch pads. Looking back, sketching has been wonderful at giving rise to design representations that naturally act as conversation starters and therefore make sketching more so compatible with agile philosophies. However, traditional pen and paper has a few limitations which over the last few months became noticeable. As a reaction to this, I grabbed an Intuos 3 from Wacom, installed Adobe Illustrator and began sketching electronically using a pen and tablet. Finding the new approach superior, I have doubts I’ll ever go back to paper and wanted to share some of the reasons why.
Scaling

Like it or not, design ideas need to scale over time and good tools provide room for such growth. One thing that I love about Illustrator (which paper lacks of course) is that the art board or workspace can be stretched as needed whenever concepts need the extra room. The flexibility to resize the canvas is a really great feature especially during early ideation when multiple screens need to be shown together to tell a meaningful story. On the same note, another way Illustrator excels is in terms of a scalable fidelity. Whereas early on in a project the amount of detail might be small, over time however, the fidelity of an electronic sketch has the potential to develop. In a vector environment it is super easy to take a small UI sketch, stretch it to a larger size, and inject more detail inside of it.

Ease of Editing

Yes, in the real world we have pencils, erasers and the ability to redraw or correct our sketches to some degree. We can however only correct our paper sketches somewhat before they becomes unreadable. This isn’t the case with anything electronic or digital where cutting, deleting, undoing, redoing, erasing is second nature. A very common scenario is to draw different screens and only learn eventually that it makes sense for the two or three screens to be placed together – something that is very easily done by reorganizing or repositioning on the computer. Another superb thing about Illustrator is the ability to select a line and just redraw it, causing it the take on the new form. This of course can be done an unlimited amount of times in an electronic tool.

Legibility

Although this might not be the case for everyone out there, I personally find that my hand writing is very hard to read. Unless I spent extra care and time to write legibly, I find that on the computer it is way easier and quicker to type out text that can be read by others.

Carelessness

When I am about to sketch on paper, knowingly that it will be harder to undo, I hold myself back and think twice before the ink or lead leaves a mark. This slow down or inefficiency can be easily overcome in the electronic world with a tablet pen. When I sketch electronically, this worry disappears as I know that I don’t have to generate the right ideas, but instead can easily correct myself if something needs adjusting. This careless quality of electronic sketching brings forth immense value by affording greater exploration to occur more freely.

Reuse

Illustrator allows to create symbols of artwork very easily which in turn speeds up exploration ever more. Let’s say you have the same screen or component which you want to use a number of times across your work. Dragging the selection into the symbols palette allows you to reuse or instantiate that artwork and still have the ability to edit it in one location with it updating throughout. This is simply a superiority that paper cannot compete with.

The above are the reasons why I moved in the direction of electronic sketching. Perhaps the use of paper can still be justified in collaborative sketching sessions when there are more than one designer at the table and the design activity happens simultaneously in real time. For the remaining times, I find that the electronic sketch offers advantages over paper that are just too good to pass.

Credits: Jakub Linowski